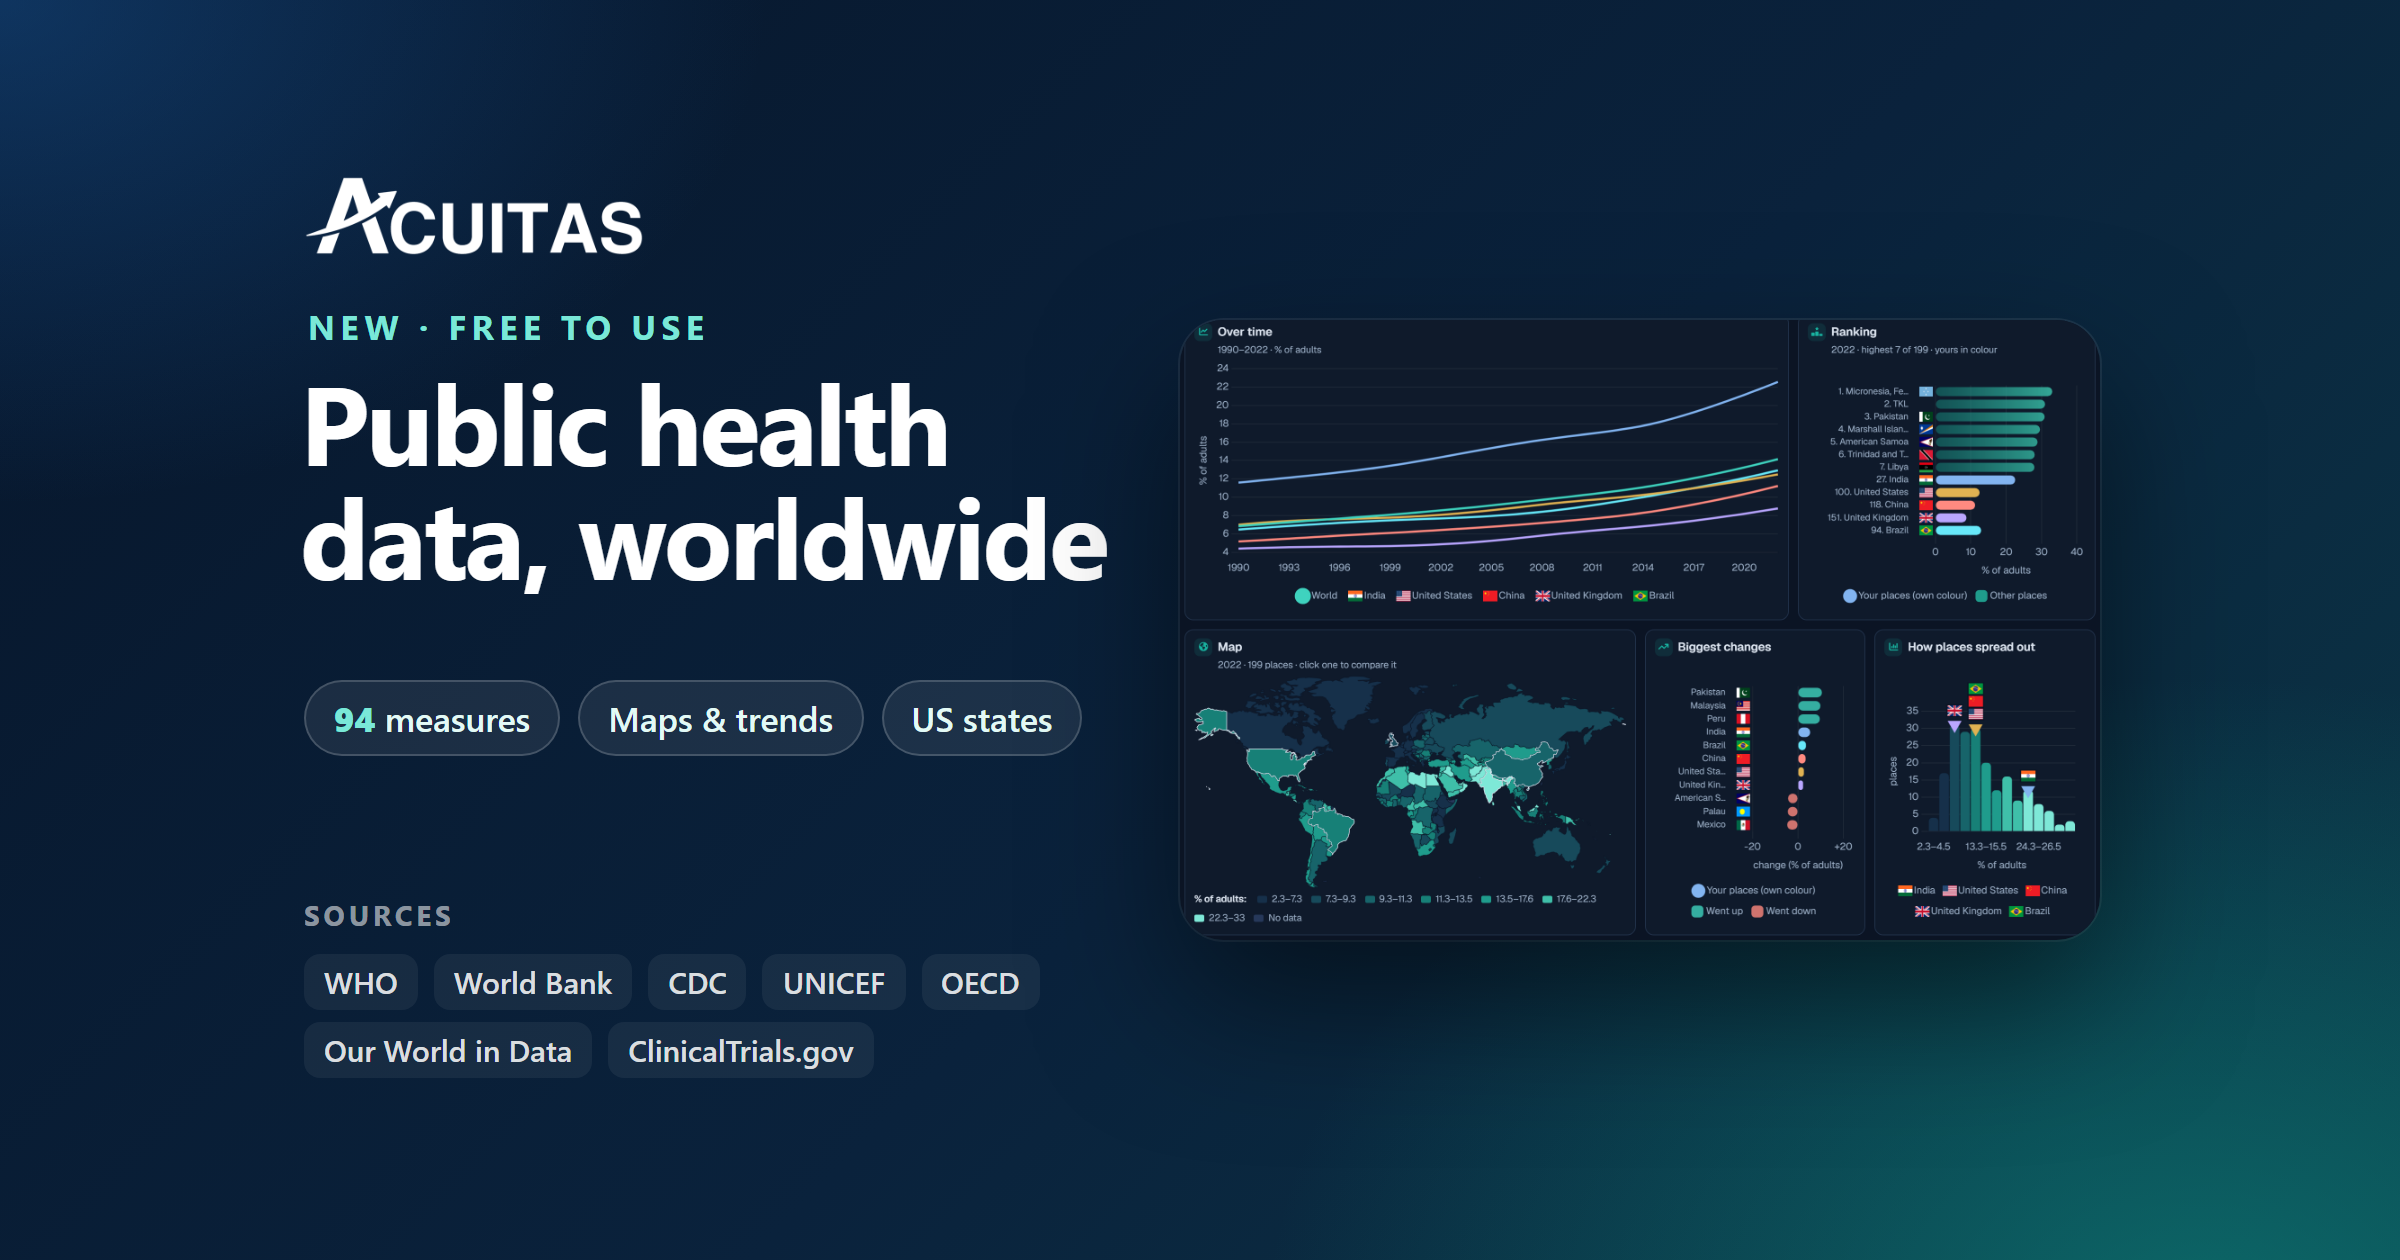
Most of our projects start the same way. Someone asks a simple question, such as how common diabetes is in India compared with Brazil, and we spend the next hour finding the answer. One figure sits in a WHO table. Another sits in a World Bank spreadsheet. The years rarely line up, the units are labelled differently, and by the time everything is in one place the original question has grown three more.
We got tired of doing that by hand, so we built a tool for it. The Public Health Data Dashboard is now live on our website. It is free, you do not need an account, and it covers 94 measures for 217 countries and every US state.
This post is a guided tour. We will follow one measure, the share of adults living with diabetes, through every view the dashboard offers. Along the way we will point out what each view is good for, and where you should be careful.
Why we built it
Public health data has never been easier to find. The World Health Organization, the World Bank, the CDC and others publish huge amounts of it, openly and for free. The hard part is everything that comes after finding it: matching country names, lining up years, checking units, and turning a long table into something you can actually read.
We do this work every week for our own research. A dashboard lets us do it once, carefully, and share the result. It also gives anyone who reads our reports a simple way to check the public context behind a market, without needing a data team.
Step one: pick a topic, then a measure
Everything starts with two choices. First you pick a topic, such as diseases, risk factors, or mothers and children. Then you pick a measure inside it. Each measure shows its unit and its source, so you know straight away what you are looking at and who published it.
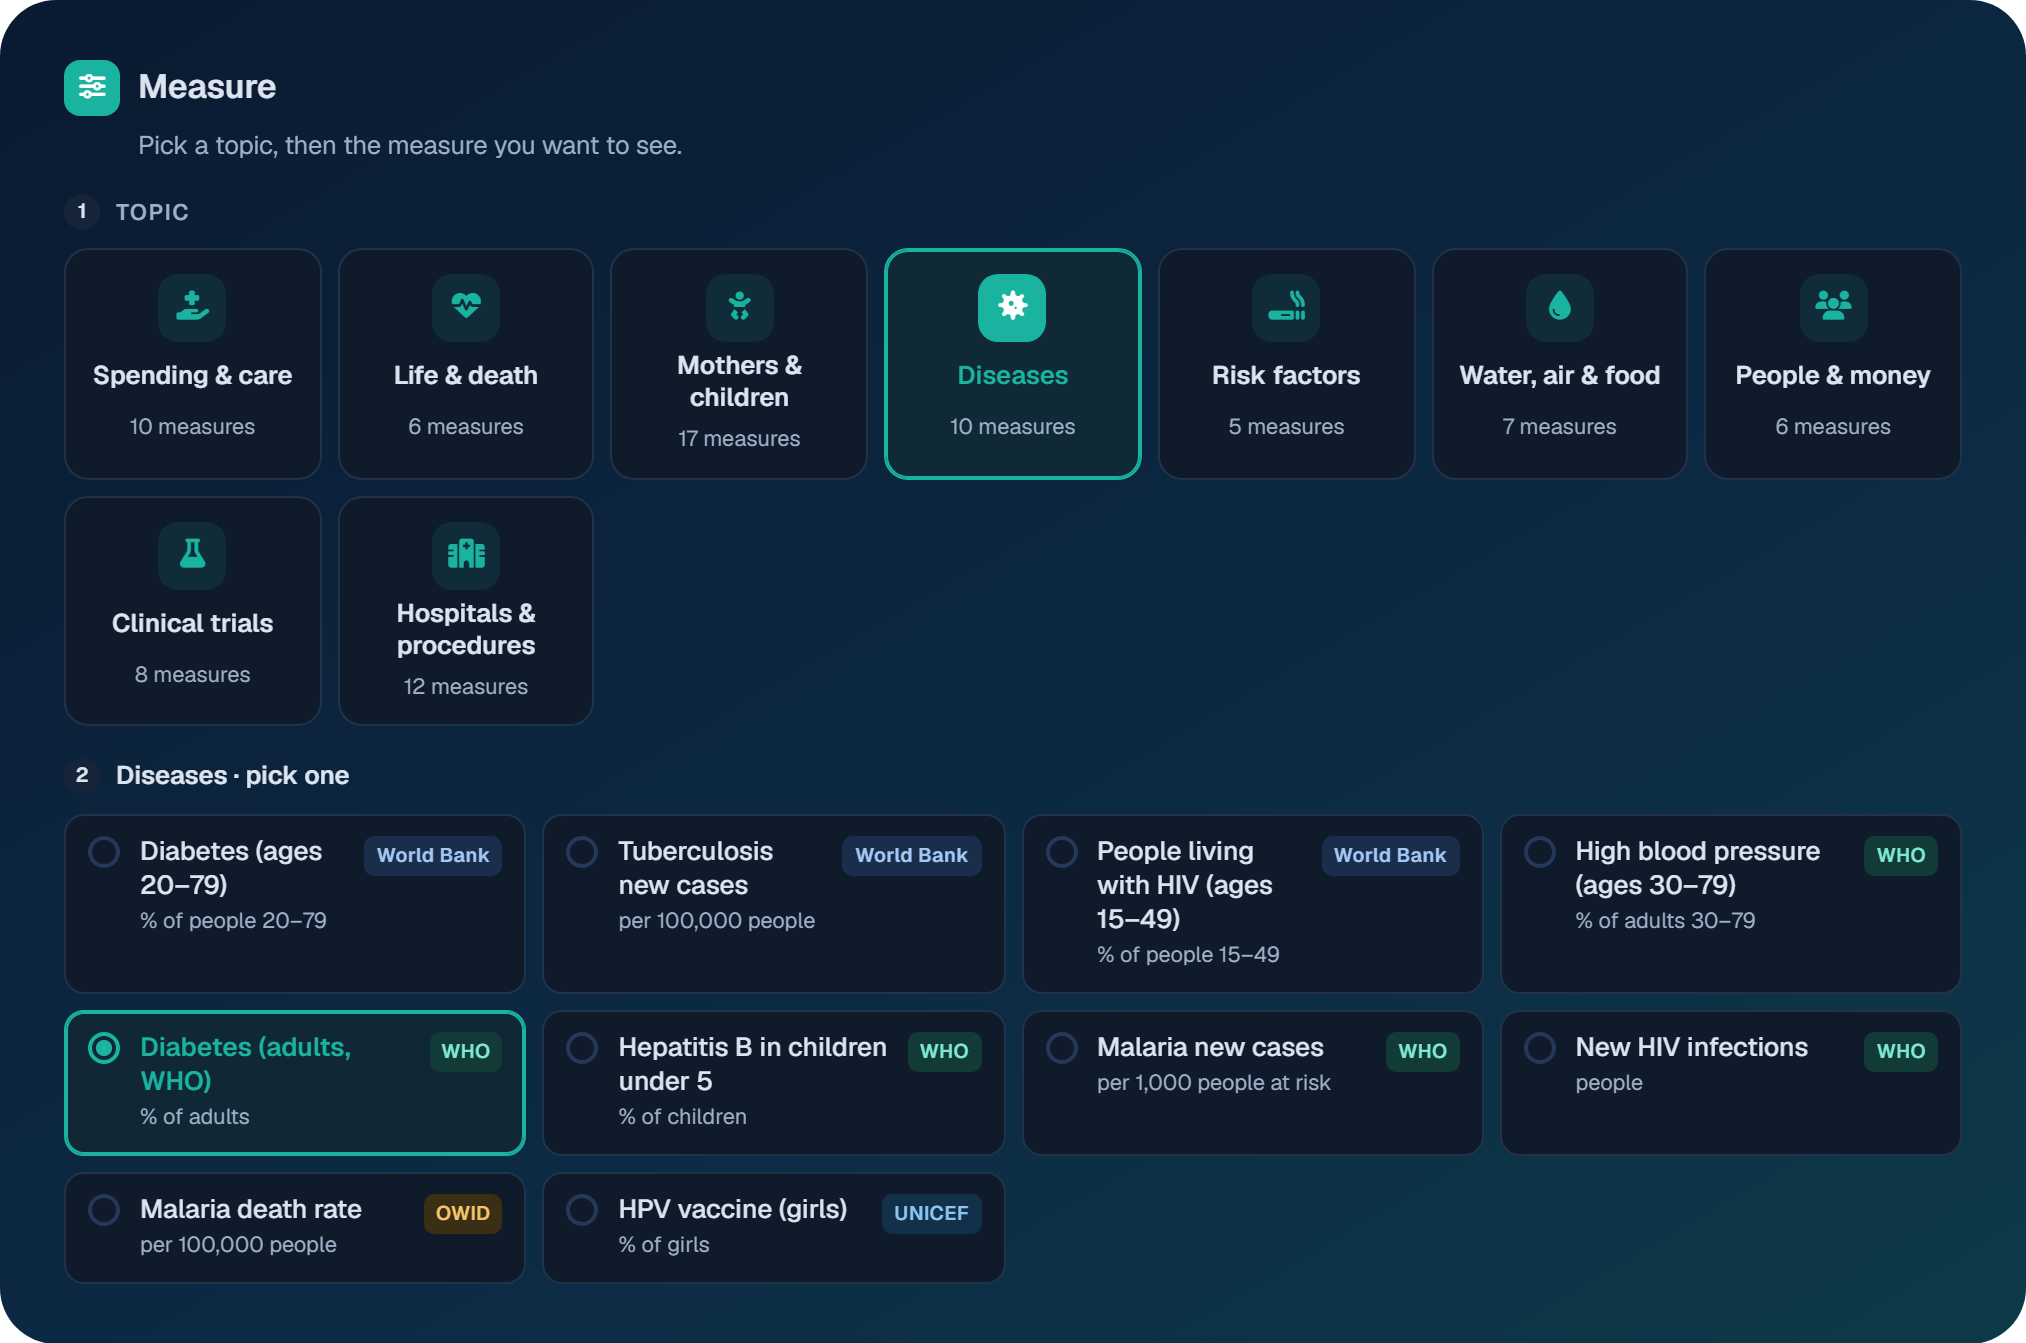
If you already know what you want, the search box finds a measure in any topic. Next to the measures, you choose up to ten countries or regions to compare. We picked the world, India, the United States, China, the United Kingdom and Brazil.
The map: where things stand
The map is usually the first thing people look at, and for good reason. It shows the whole picture in one glance. Darker shades mean lower values and lighter shades mean higher ones.
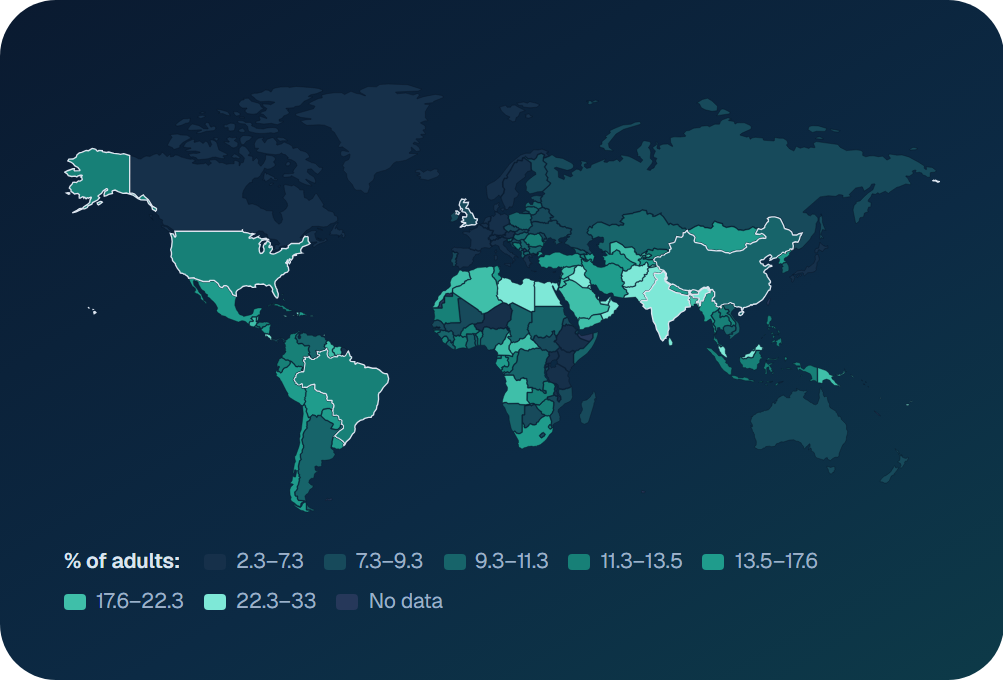
For adult diabetes, South Asia, North Africa and parts of the Middle East stand out straight away. Much of Europe and sub-Saharan Africa sits in the darker bands. A map like this does not explain why, but it tells you where to look next.
The trend: how places got here
A map shows one year. A trend shows the journey. The line chart follows each place you picked across every year the source covers.
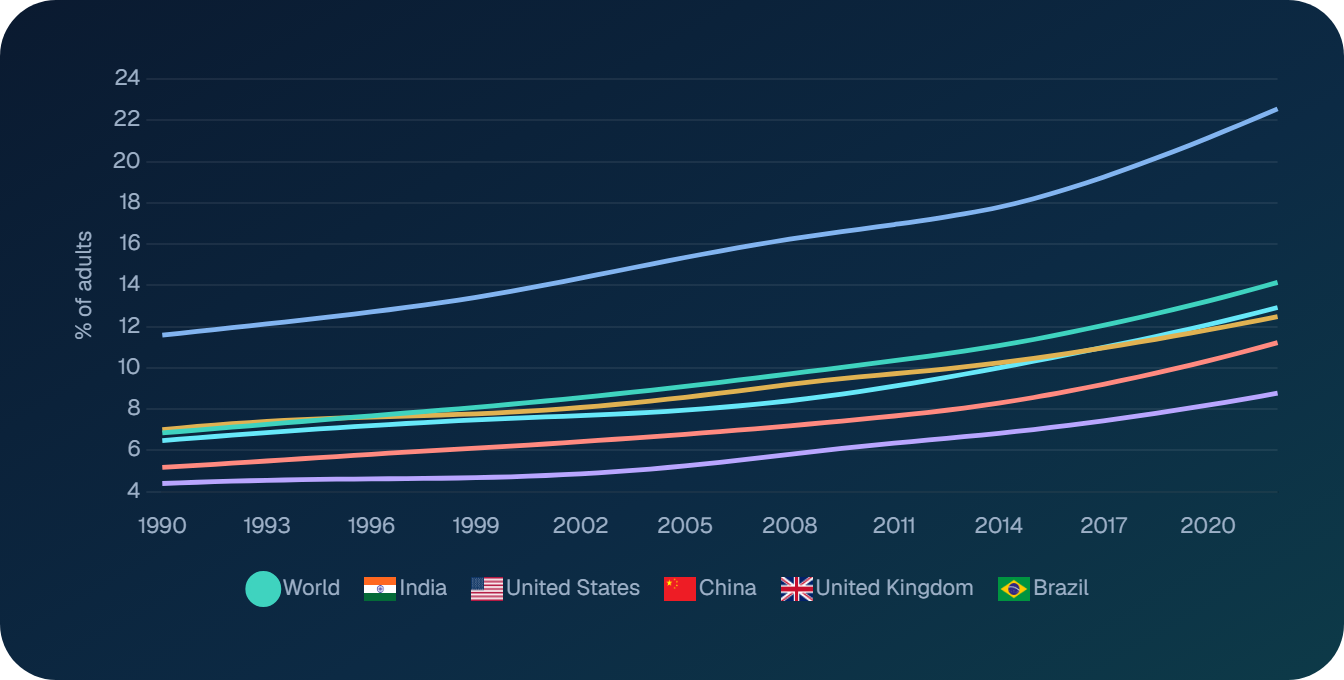
In our example, the share of adults with diabetes in India nearly doubled between 1990 and 2022, reaching 22.6%. The world figure for 2022 is 14.1%. Every place we picked is higher now than in 1990, though the pace differs a lot.
Latest values at a glance
Sometimes you only need the headline numbers. The latest-value cards give you that: the most recent figure for each place, a small trend line, and how much it has changed.
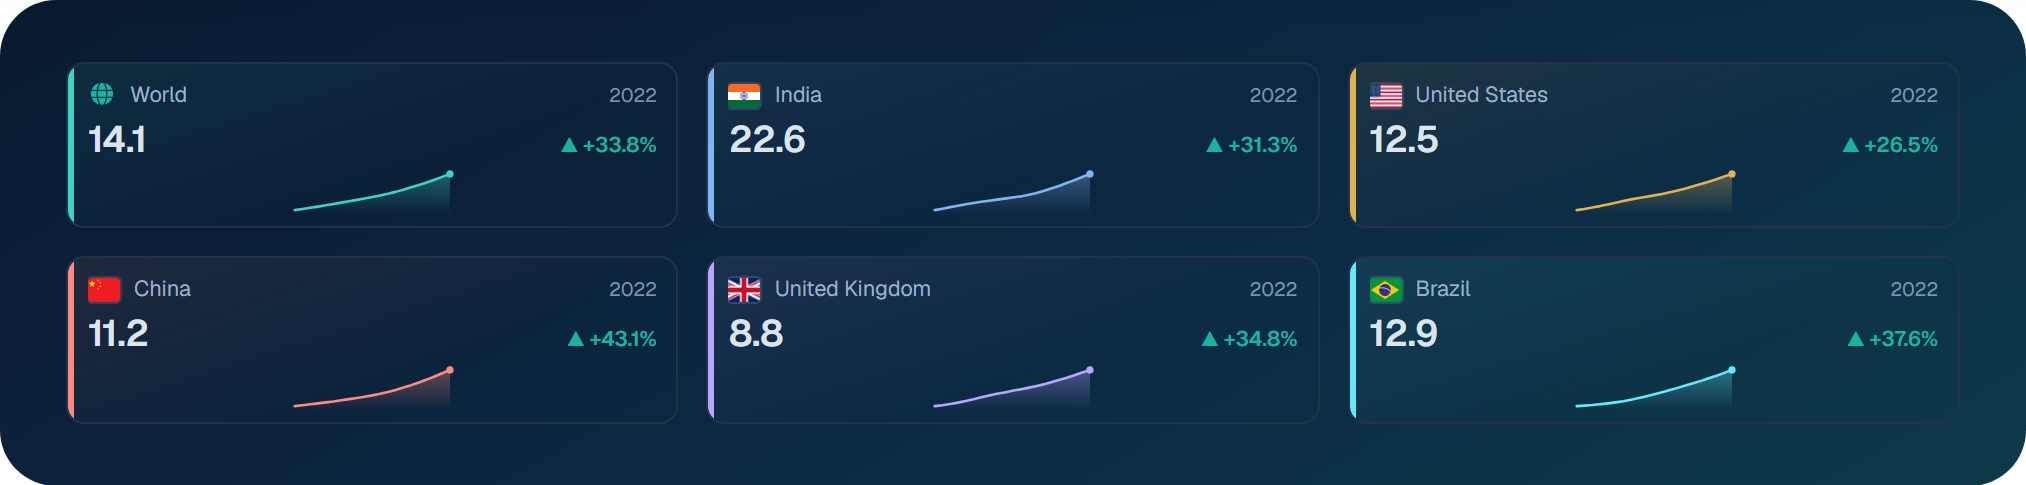
Note that the change is a percentage of the starting value, not percentage points. A rise from 10% to 13% shows as +30%. The cards are handy for slides and quick notes, because they fit a lot into very little space.
How places spread out
Averages hide a lot. The spread chart groups every place into bands and counts how many fall into each. Your selected places appear as flags above their band.
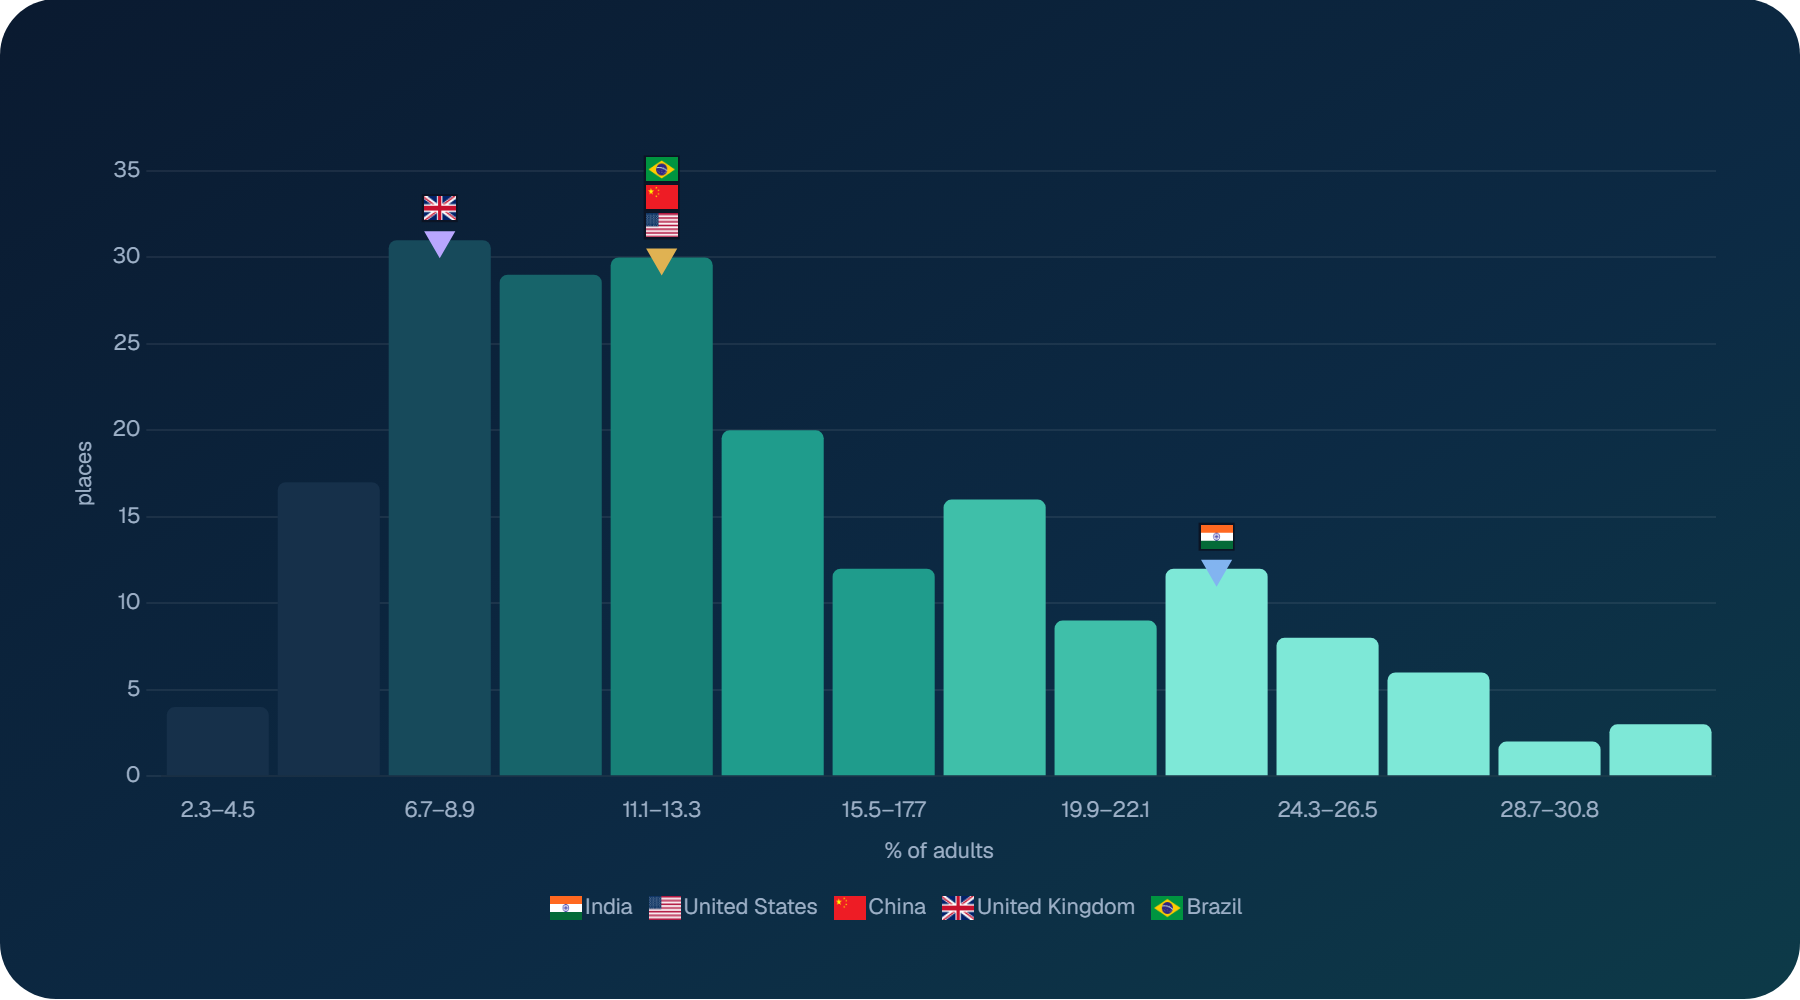
This view answers a question people often forget to ask: is a figure unusual, or is it normal? The United Kingdom, the United States, China and Brazil all sit in the crowded middle. India is well to the right of it.
Who changed the most
The biggest-changes chart ranks places by how much they moved over a period you choose, five, ten or twenty years. Green bars went up and red bars went down.
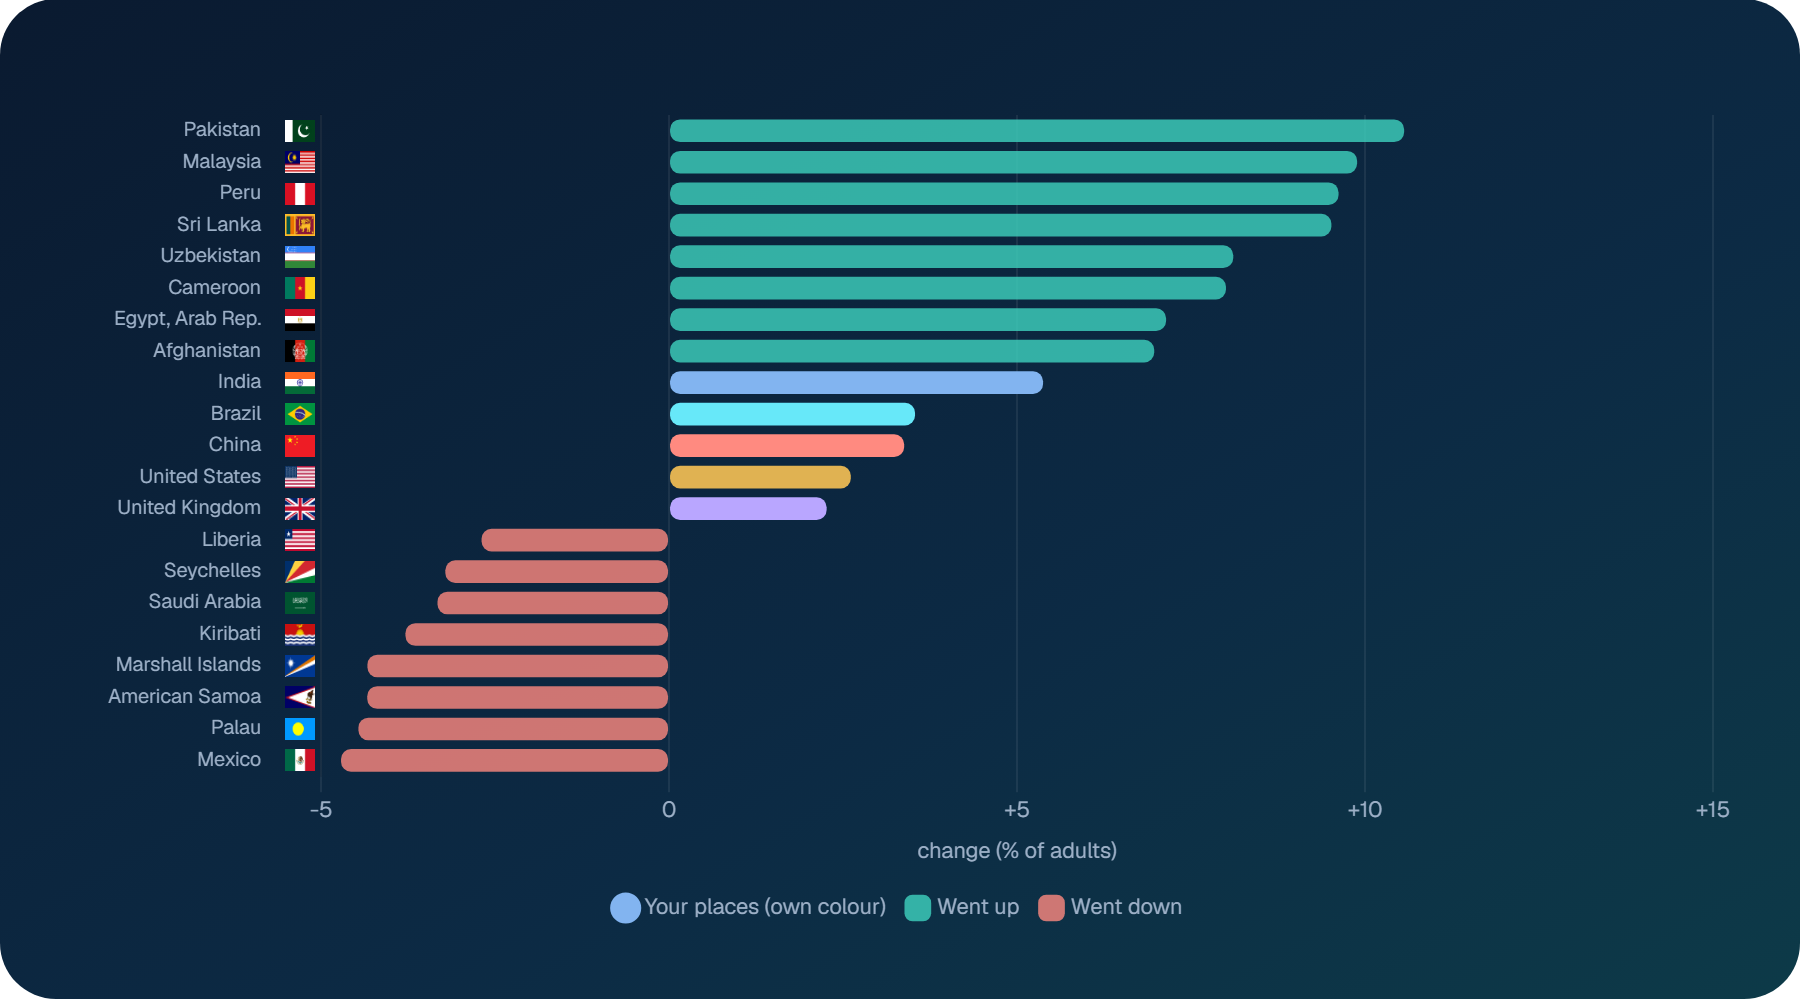
Places that changed the most are often the most interesting to study. A sharp rise can point to changing diets, ageing populations or better testing. A fall can reflect prevention work, or simply a change in how the data was collected. The chart tells you where to dig, not what you will find.
Regions side by side
The regions view groups countries by World Bank region. Each bar runs from the lowest country to the highest, the white mark shows the middle country, and every dot is one country.
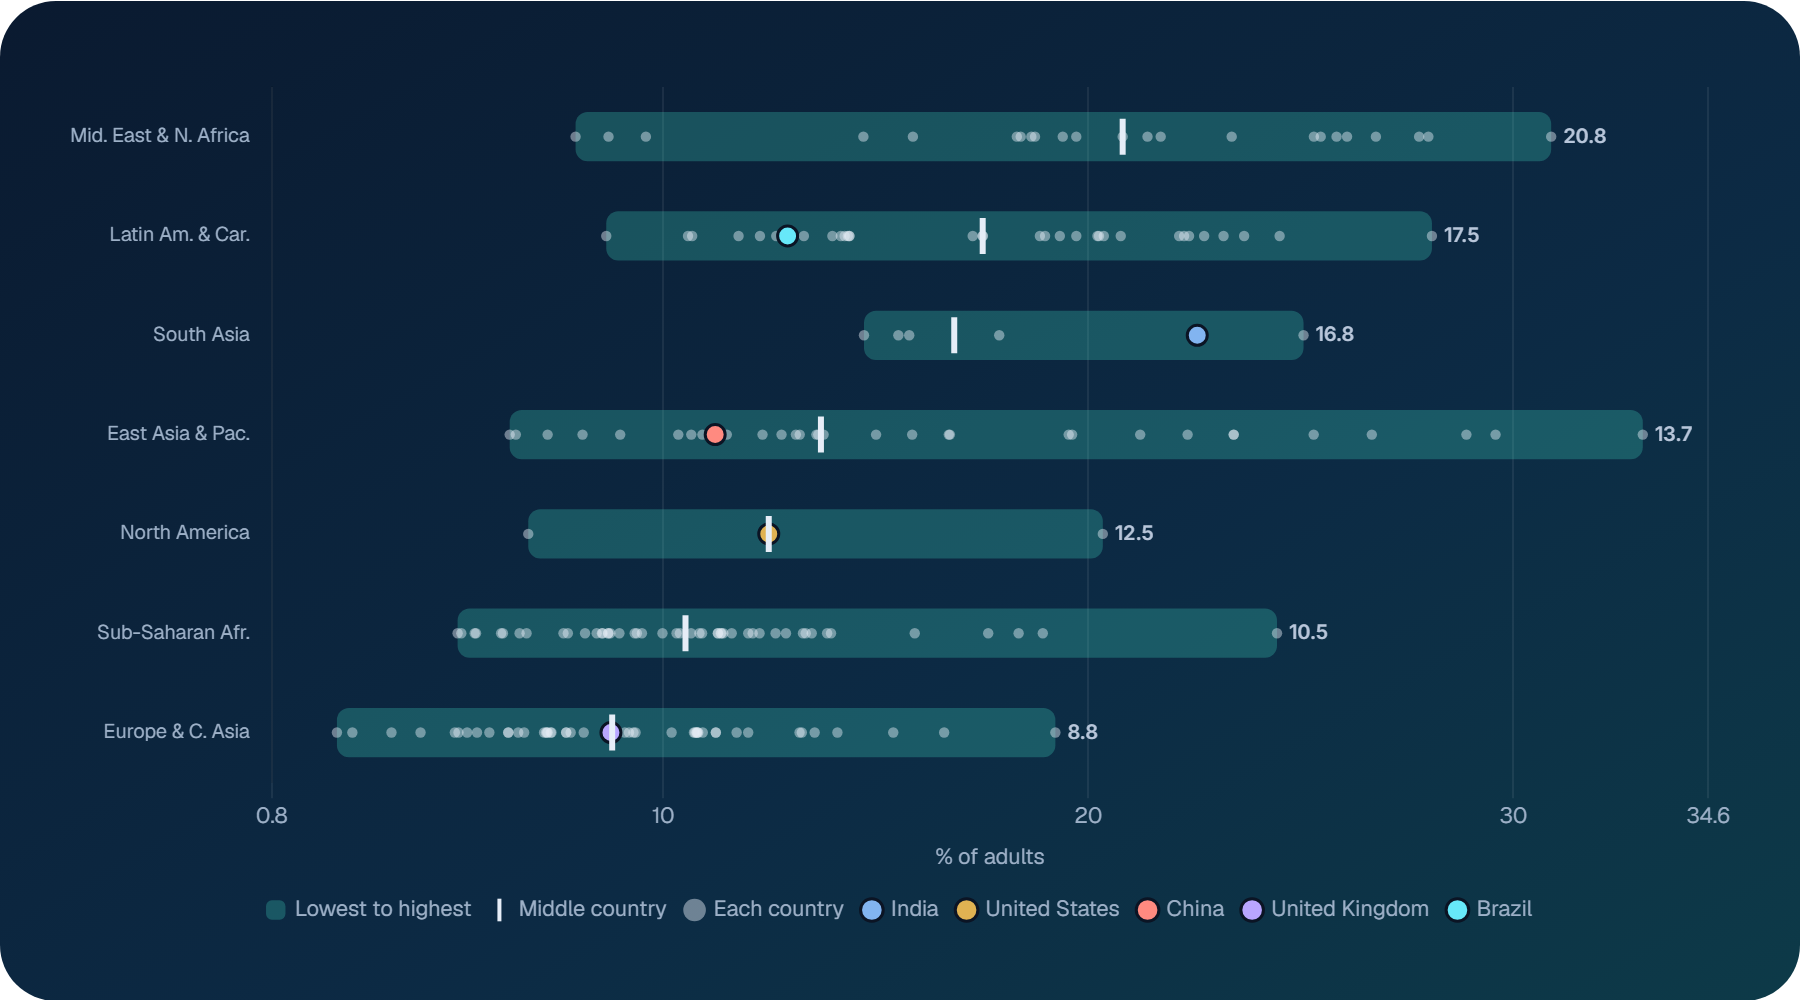
This view is useful when a country figure feels high or low and you want context closer to home. India, for example, sits towards the top of South Asia, while China sits below the middle of East Asia and the Pacific.
Comparing two measures
Health questions rarely involve one number. The bubble chart plots your measure against a second one of your choice. Each bubble is a place, and bigger bubbles mean bigger populations.
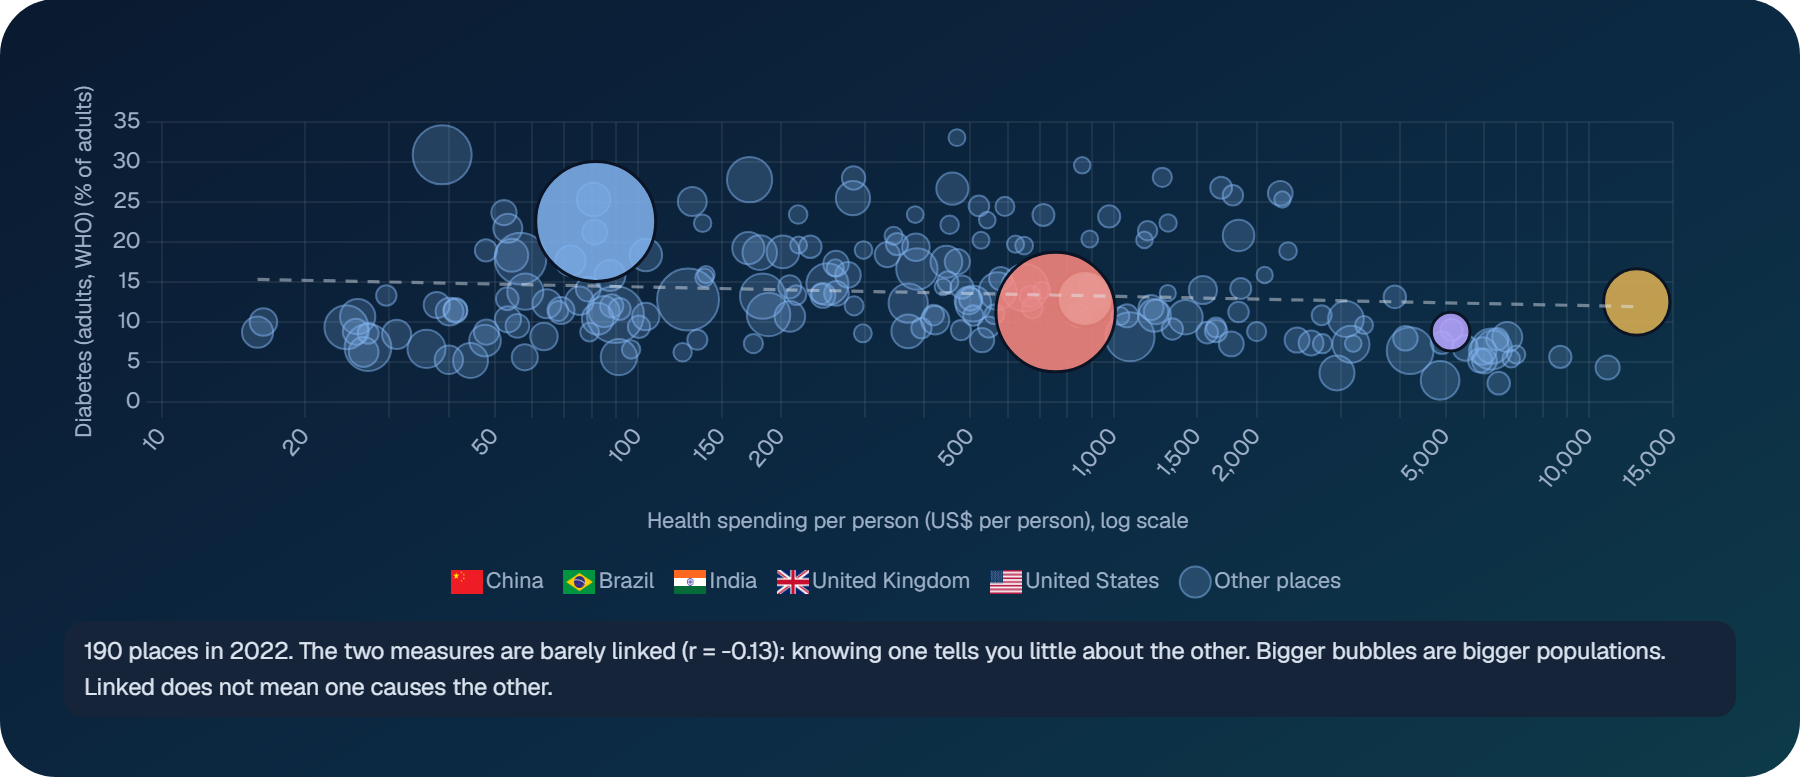
We added the plain-language note on purpose. A correlation number on its own is easy to misread, and two measures moving together does not mean one causes the other. Here, spending more on health per person tells you very little about how common diabetes is.
Where the trend is heading
People often ask what happens next. The trend view extends each line by five or ten years, drawn as a dashed line so it never looks like real data.
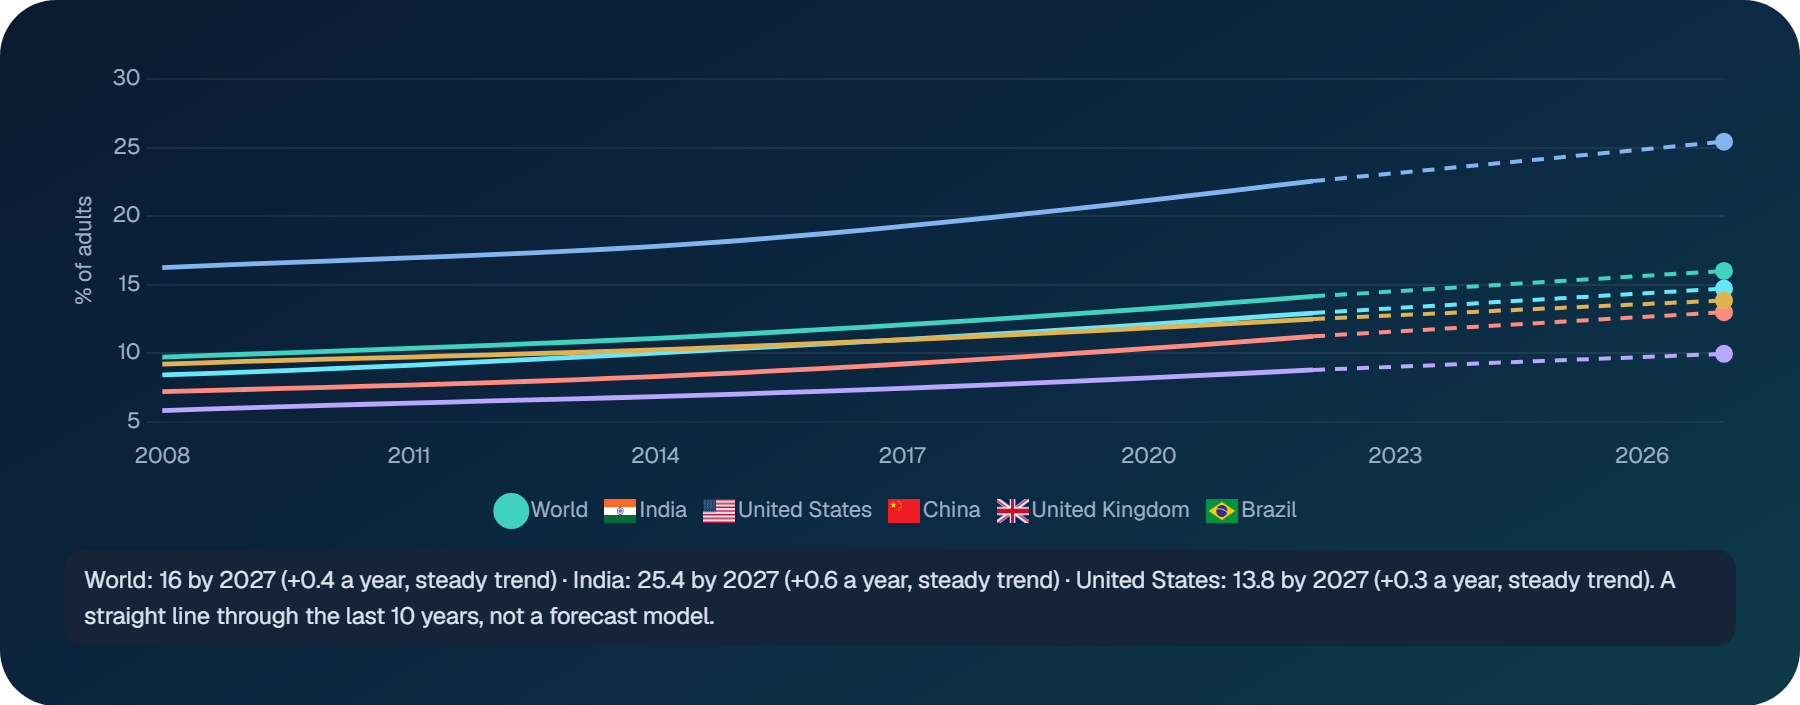
We want to be clear about this one. A straight line through recent years is a useful “what if”, nothing more. Real forecasts need much more work, which is what our market research does.
A health profile in one shape
The profile chart pulls seven measures together for each selected place: life span, health spending, doctors, care coverage, clean water, child survival and healthy weight.
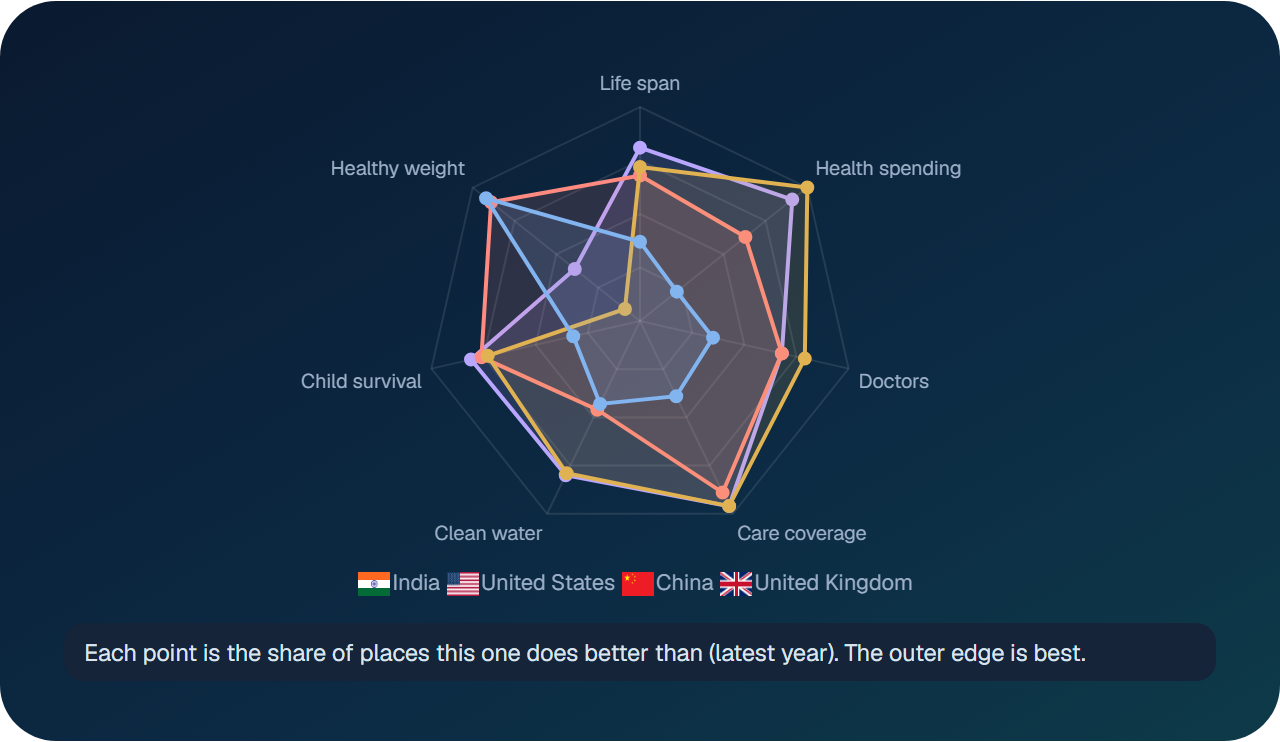
Because each point is a ranking rather than a raw value, the seven measures fit on one scale. It is a quick way to see the overall shape of a health system before you look at any single number.
US states get their own view
Countries and US states have separate views, because the data behind them is different. For states, the dashboard uses CDC sources, with measures such as heart disease death rates and adult obesity.
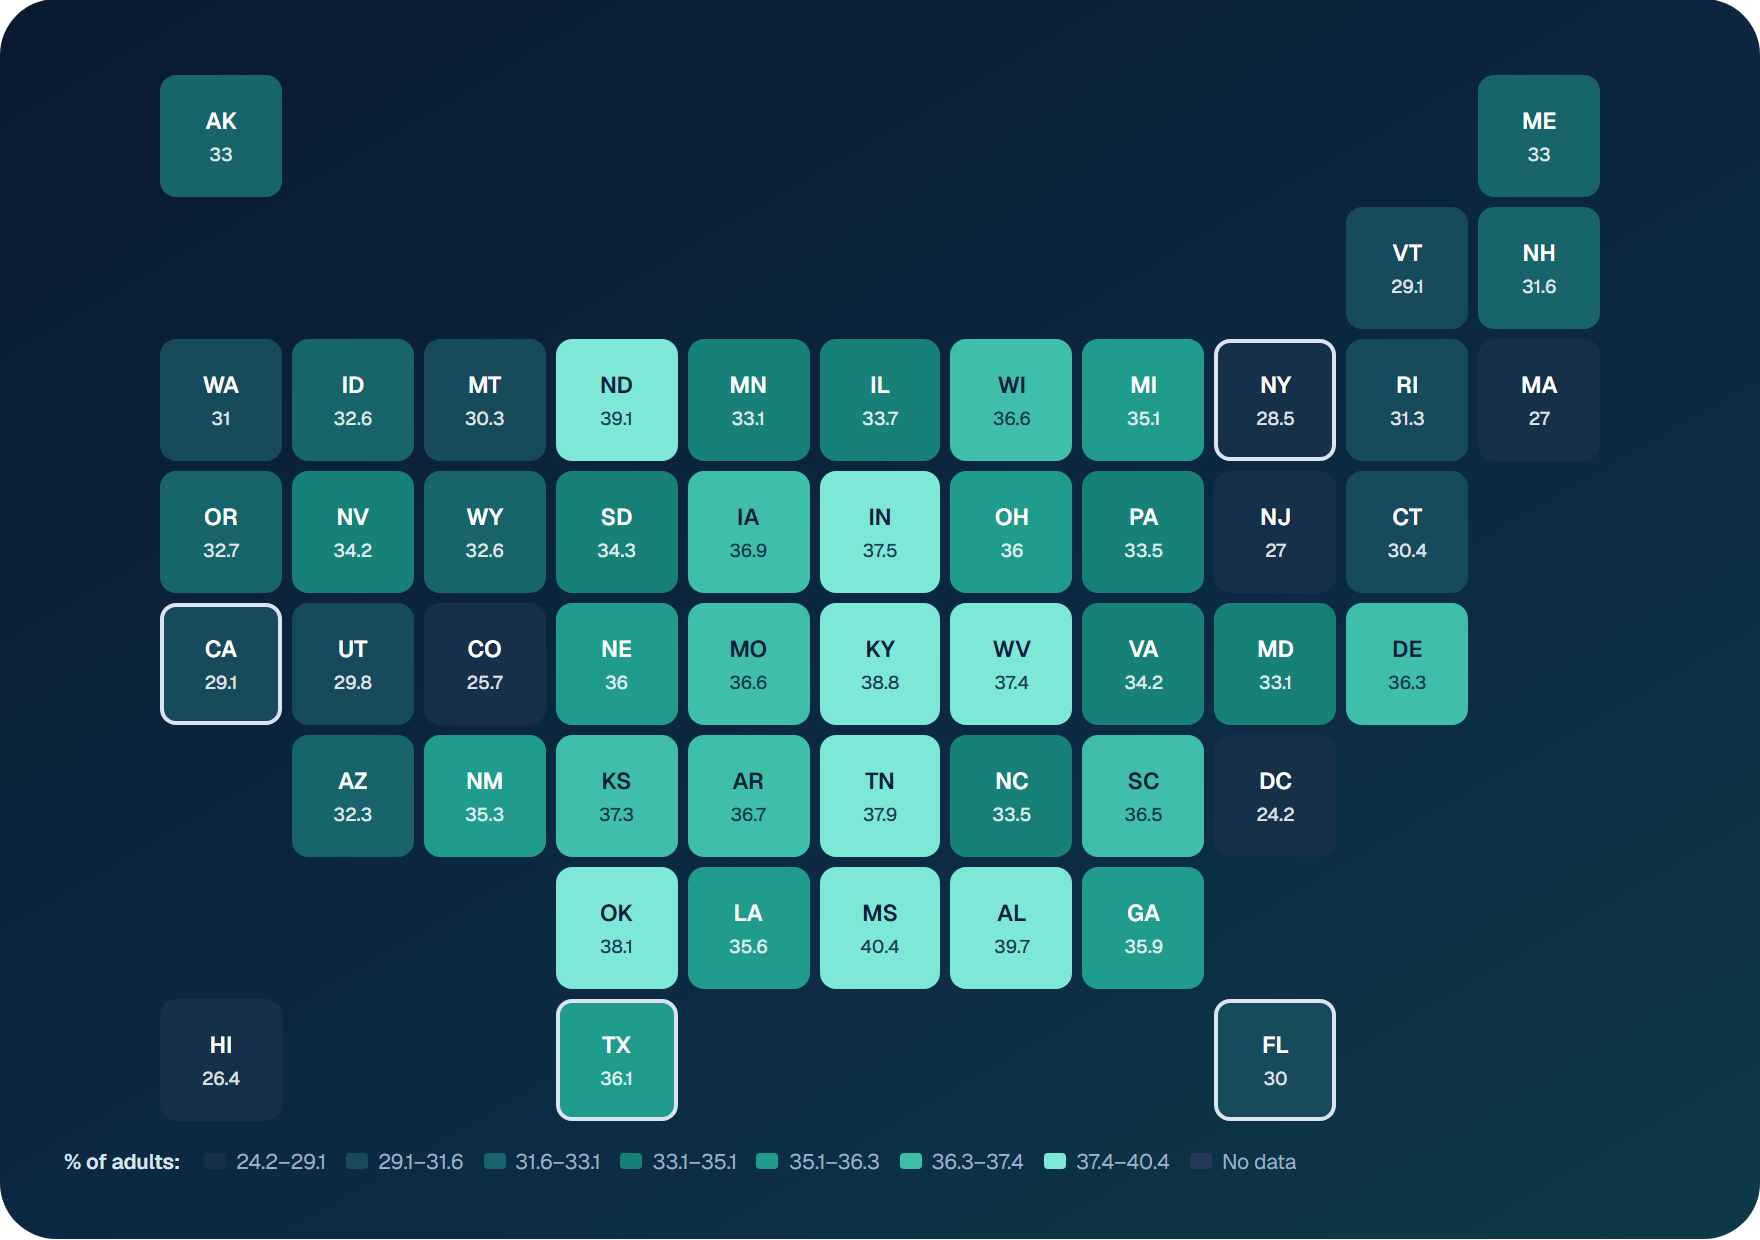
On adult obesity, Mississippi is highest at 40.4%, while Washington, DC is lowest at 24.2%. The same charts work here too: trends, rankings, spread and changes over time.
Sharing, downloading and the data table
Every measure has its own web address, and the address keeps your choices. If you pick six countries and a measure, then copy the link, a colleague who opens it sees exactly the same view. That makes it easy to drop a chart into an email, a report draft or a team chat without taking a single screenshot.
When you need the numbers themselves, the CSV button downloads the figures for your selection, ready for Excel or any other tool you prefer. There is also a full data table on the page, with every place and year laid out in rows. It is less exciting than a map, but it is often what people need most when they are writing something up and want to quote a figure correctly.
Each chart can also be expanded to fill the screen. This helps on a laptop, and it is useful in meetings, where a small chart in a busy page is hard for a room to read.
Public evidence on our report pages
The same public data now appears on our market report pages, matched to each market. A report on diabetes care devices in India, for example, shows active clinical trials and a short country profile.
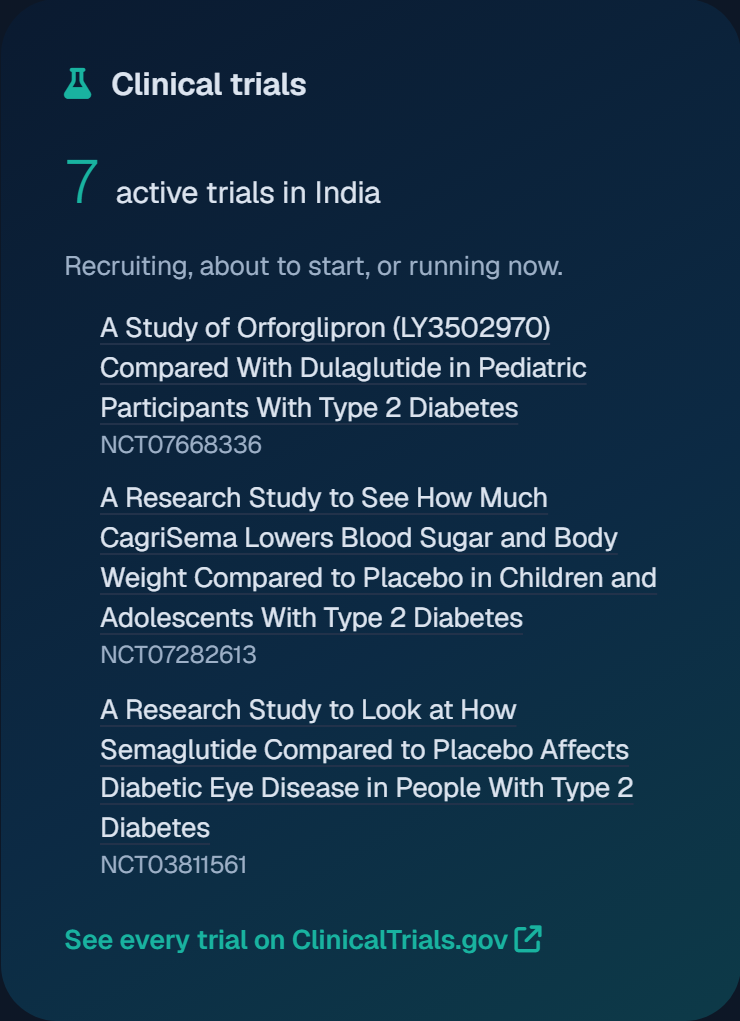
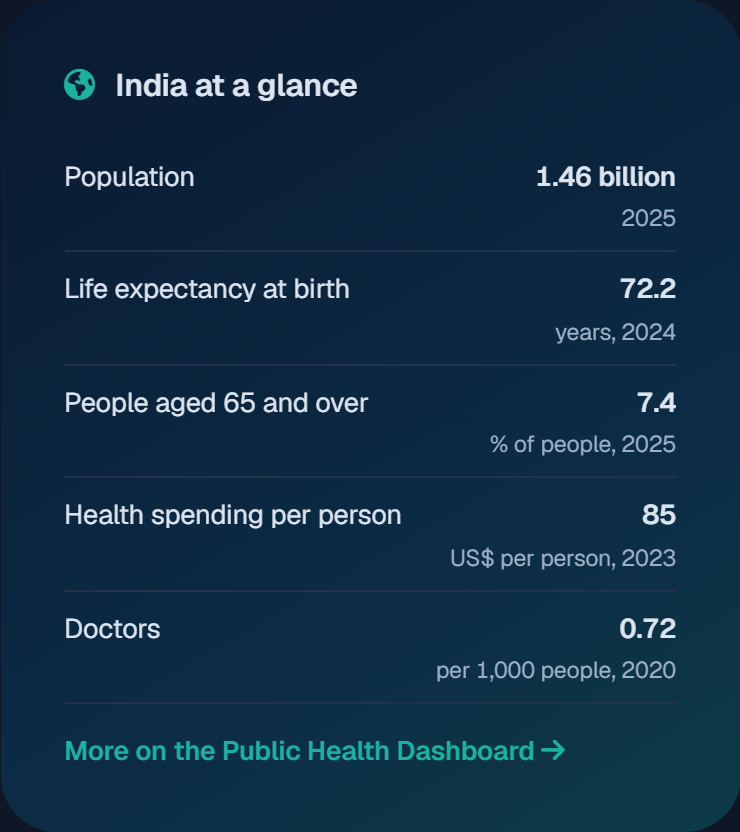
Report pages can also list recent papers from PubMed on the same topic. Together, these give readers a sense of what doctors and researchers are working on, before they ever open the full report.
Where the numbers come from
We do not create these figures. They come from public sources, and each one is credited on the dashboard. Here is the full list, with one example from each:
- World Bank: health spending as a share of GDP
- World Health Organization: healthy life expectancy
- Our World in Data: malaria death rates
- CDC: US death rates by state
- UNICEF: measles vaccination
- ClinicalTrials.gov: active diabetes trials
- OECD Health Statistics: knee replacements
Each source publishes on its own schedule, so the latest year can differ between measures. The dashboard always shows which year you are looking at. Licences and common questions are on the sources page.
What stays inside a purchased report
We keep one clear line. Public figures stay public and credited to their publishers. Our own market sizes, forecasts and company analysis remain part of the full report, along with the methods and sources behind them.
That line matters for trust. A WHO figure should never look like an Acuitas estimate, and an Acuitas estimate should never appear without its method. You can read more about our approach in how we estimate.
A few honest limits
No dashboard is perfect, and this one is no exception. A few things are worth keeping in mind:
- Data lags. Many global figures arrive two or three years after the year they describe.
- Methods differ. Two sources can measure similar things in different ways, so compare within one measure where you can.
- Gaps exist. Some places have no data for some measures. The map marks these clearly rather than guessing.
- Trends are not forecasts. The dashed lines are simple extensions, not predictions.
- Links are not causes. Two measures moving together does not mean one drives the other.
When something looks surprising, the source link is always one click away. We encourage you to check it.
Who we think will find it useful
We built it for our own work, but we can think of plenty of others who might use it. Students can explore a topic before writing a paper. Programme teams at NGOs can check where a problem is growing. Journalists can find a reliable figure quickly, with its source attached. Product and strategy teams can see the health context around a market they are entering.
If you use it for something we have not thought of, we would love to hear about it.
Try it, then tell us what is missing
We built this for the questions we answer every week, but yours may be different. If there is a measure you need, or a comparison that feels clumsy, let us know. We read every message.
If you enjoy working with health data, you may also like our earlier piece on how data analytics is changing healthcare.
Open the dashboard and start with a question of your own.
Go deeper